Nervous about your data?
Analyzing marketing data can cause a great deal of anxiety. The data is diverse and not every pattern can be explained by information that can be tracked. It creates conundrums and makes you feel overwhelmed by something as simple as figuring out where to start. This is a natural feeling as choices, like those created by conducting data analysis, pull our mind in various directions preventing us from being able to focus on the big picture and tell a linear story.
The best tactic to avoid this fate is to adopt a data exploration framework that sets a specific course to be taken in order to answer the questions looking to be answered with this analysis. This framework should evolve from experiences that you have come across in your own data analysis, but to provide some inspiration and help build a foundation for your own, I have shared areas of your data in the sections below that should be explored to provide you with a stronger understanding of your data and keep you away from going off on tangents during your analysis.
Understand the question that you are trying to answer
This might sound like a trivial starting point in the data exploration process, but I have found it to be extremely common for people to misinterpret or forget the questions that they are trying to answer. In order for your work to stay on track and answer the question(s) being asked, it is important to translate the question into the data that you will be analyzing. Dissect the question and replace important keywords with their dimension or measure equivalent. Provided below is an example of what this looks like.
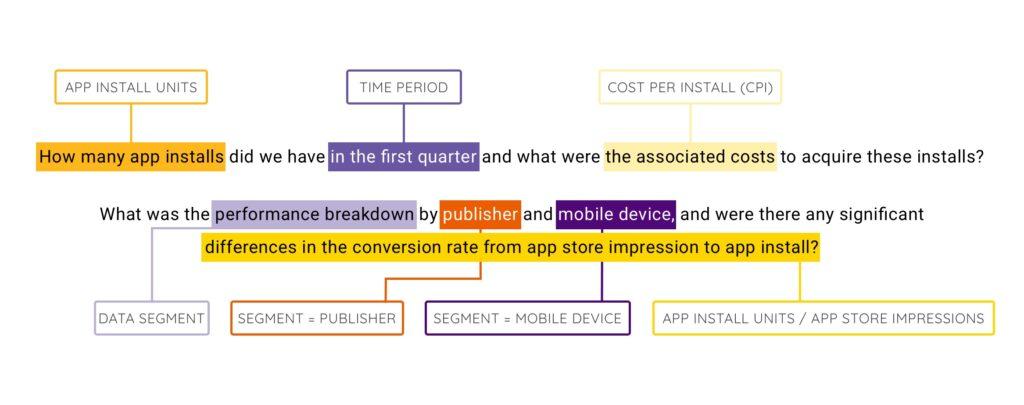
After translating the questions being asked, relay the translation back to the person who asked it to ensure that your interpretation is correct. By translating this question into a data structure, you have laid out the key variables that need to be included in the data set in order to start this analysis.
Interpret the dataset
Once a dataset is generated, your first thought might be to jump right into transforming, segmenting and pivoting the data, but you need to resist this urge and start by learning more about the data that you have just generated. Educating yourself on the data set is commonly called summary statistics and summarizes the data being observed in an interpretable manner. This process will come in handy in a variety of ways like identifying trends and patterns with minimal effort or discovering issues that could impact the accuracy or confidence in your results. When summarizing your data set, think about answering two questions that highlight information about both types of data that are present, qualitative (labels) and quantitative (numbers).
What are all of the possible qualitative (labels) values that are present in the data set?
Why is this important? Qualitative (labels) values are more descriptive than numbers making it an easier guide for interpreting your data set. It also has the ability to reveal dirty data that needs to be cleaned up prior to conducting further analysis. In marketing data, it is common to have various marketing campaigns running simultaneously across different publishers, creating a lot of qualitative values to consider. It is important to distinguish these individual performances as every publisher and campaign will perform differently. In addition, you are almost certain to end up with dirty data as tracking these campaigns involves human interaction and as a result human error.
What are the minimum value, maximum value, mean and standard deviation values for each quantitative column?
Why is this important? These calculations summarize the location and variability of the data points within your data set. Understanding the distribution and shape of the data will help to distinguish patterns and trends in the data set that should be examined further. This comes in handy with marketing data as the various attributes (qualitative data) associated with this type of data creates various segments that can be analyzed. By analyzing these attributes in this manner, you will be able to determine what is worth investigating (a lot of variability) and what is not (no variability) without having to spend time building pivot tables or visualizations.
Explore the data for patterns
Once you have examined the data distribution and narrowed your focus on the patterns that you would like to investigate further, it is time to understand the relationships between the dimensions and metrics and determine if outliers exist. To start this process, we must do some data clean up. This clean up involves determining if outliers or extreme values that are distant from most of the other observations, can be justifiably removed due to dirtiness or irrelevance to the analysis. The simplest statistical way to detect outliers are with box-plots or interquartile ranges. These techniques set boundaries at specific percentiles within the data set and the data points that fall outside of these boundaries are labeled outliers or anomalies to the sample. Removing outliers will help improve the accuracy in your analysis as long as they can justifiably be removed by either being the result of dirty data or irrelevant to your data analysis.
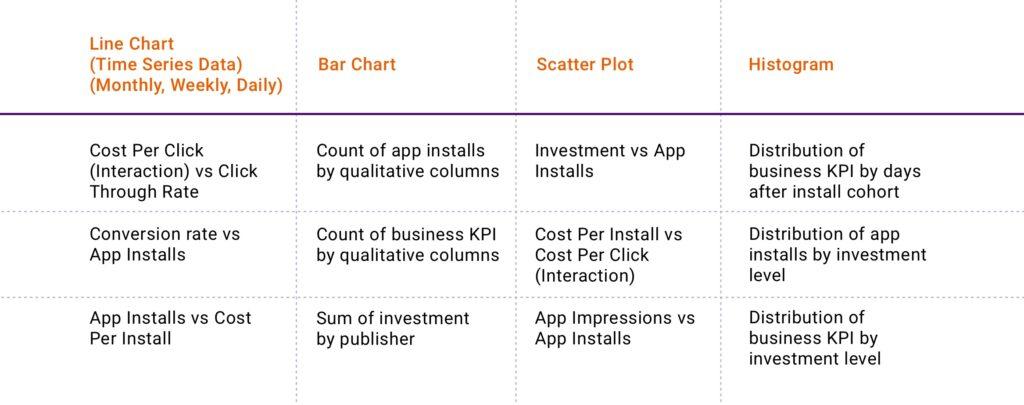
After making decisions about the outliers that exist, it is time to visualize combinations of dimensions and metrics to understand if any relationships exist and patterns that can help to answer our questions. This stage in the analysis process, like the question of “where to start?”, is overwhelming because there are endless possibilities of visualizations and data combinations that can be analyzed. Unfortunately there is no templatized answer to steer us in a specific direction like we had when translating the question, but hopefully the output of our earlier data distribution analysis has helped to narrow your focus on patterns that are interesting to investigate. With this in mind, use my example table of data points and complimentary visualization types below to help simplify the visualization process.
Data cleanup and next steps
The final stage of this framework focuses on more data cleaning (it never ends!) and determining the next steps in your analysis. While we used mathematical functions to clean up the data in previous sections, the cleaning at this stage is subjective. It should be focused on removing the data points that are deemed irrelevant to the questions we are trying to answer. By running this additional cleaning, you will be able to keep your mind focused on the trends that matter and the task at hand.
Once the data set is clean, it is time to take a step back and understand if your analysis answers the original questions that were asked. If you can answer the questions with supported evidence, then your work is done! If it isn’t, then this framework should have provided you with direction on the areas that need to be analyzed in more detail to answer the questions or work that requires more data collection to be completed.
Conclusion
Conducting data analysis for marketing data can be an overwhelming task and experience. Campaigns across various publishers are being run simultaneously and the audiences they target make it difficult to interpret patterns without considering multiple variables, including those that cannot be traced. The best approach to tackling work like this without being anxiety-ridden is to adopt a framework like the one I described above. It keeps your mind focused on the questions looking to be answered and away from sporadic thoughts that create detours along the way. Life is easier with less choices so why should your approach to analyzing marketing data be any different?
Once the data set is clean, it is time to take a step back and understand if your analysis answers the original questions that were asked. If you can answer the questions with supported evidence, then your work is done! If it isn’t, then this framework should have provided you with direction on the areas that need to be analyzed in more detail to answer the questions or work that requires more data collection to be completed.